Gain access to instant map-based view of traffic data across the United States. TrafficZoom covers all traffic routes and road sections with AADT exceeding 300, giving business analysts, site selection specialists, planners, and engineers the insights they need to act decisively.
✔ Hourly, weekly & monthly AADT
✔ Traffic flow demographics: age, income, education, ethnicity
✔ API available
Need to dive deeper? Order industry-leading location specific C-Site Insight™ reports online
Try it now

TrafficZoom Dashboard
Ticon Dashboard is excellent upgrade to the TrafficZoom product for Transportation Performance Management - a strategic approach that uses system information to make investment and policy decisions and helps decision makers allowing them to understand the consequences of investment decisions across the transportation network.
TraffcZoom Dashboard provides key information for Transportation Performance Management by delivering instant information on the Level of Service (LOS) and other metrics for each street in the whole city or in any chosen square on the map, including:
• Areal performance: Travel time and Traffic delay, Speed capacity and performance, Network Bandwidth utilization by hours
• Streets performance: Travel time and Traffic delay, LOS for each street and each segment of each street for the entire day or period of time during the day
By automating LOS determination the TrafficZoom Dashboard allows instant understanding of the traffic management efficiency and helps in mobility improvement planning

TrafficScope
Trafficscope, ITS development and 'Before-after' Evaluation Smart Tool, combines the advantages of traffic detection monitoring and floating car study for just a fraction of cost. We generate 24/7/365 high resolution data stream for calculating true values of:
• ADT by day, month, year
• Actual space speed, speed and travel time distribution
• Intraday traffic volumes.
We use these data to calculate real changes in vital traffic patterns in the corridor of study and to determine improvement efficiency metrics for each section of the road with high temporal (up to 15 min) and spatial (up to exact address) resolution.
The report can be generated for any chosen periods ‘before’ and ‘after’ the improvement measures had been implemented. Generating the report for only one ‘current’ period of time helps to identify problematic places and time slots, as well as to understand possible improvement benefits.
With TrafficScope reports you can choose optimal places for renewal and optimization; set contractor goals and customer expectations properly; support continuous improvements and align contractor compensation with achieved efficiency.

C-Site Insight

C-Site Insight, a new upgraded version of StreetSiteTraffic - Business Site Traffic Analysis and Reporting system provides smart decision support for retail site selection.
Our report offers unique benefits to retailers and store operators by providing:
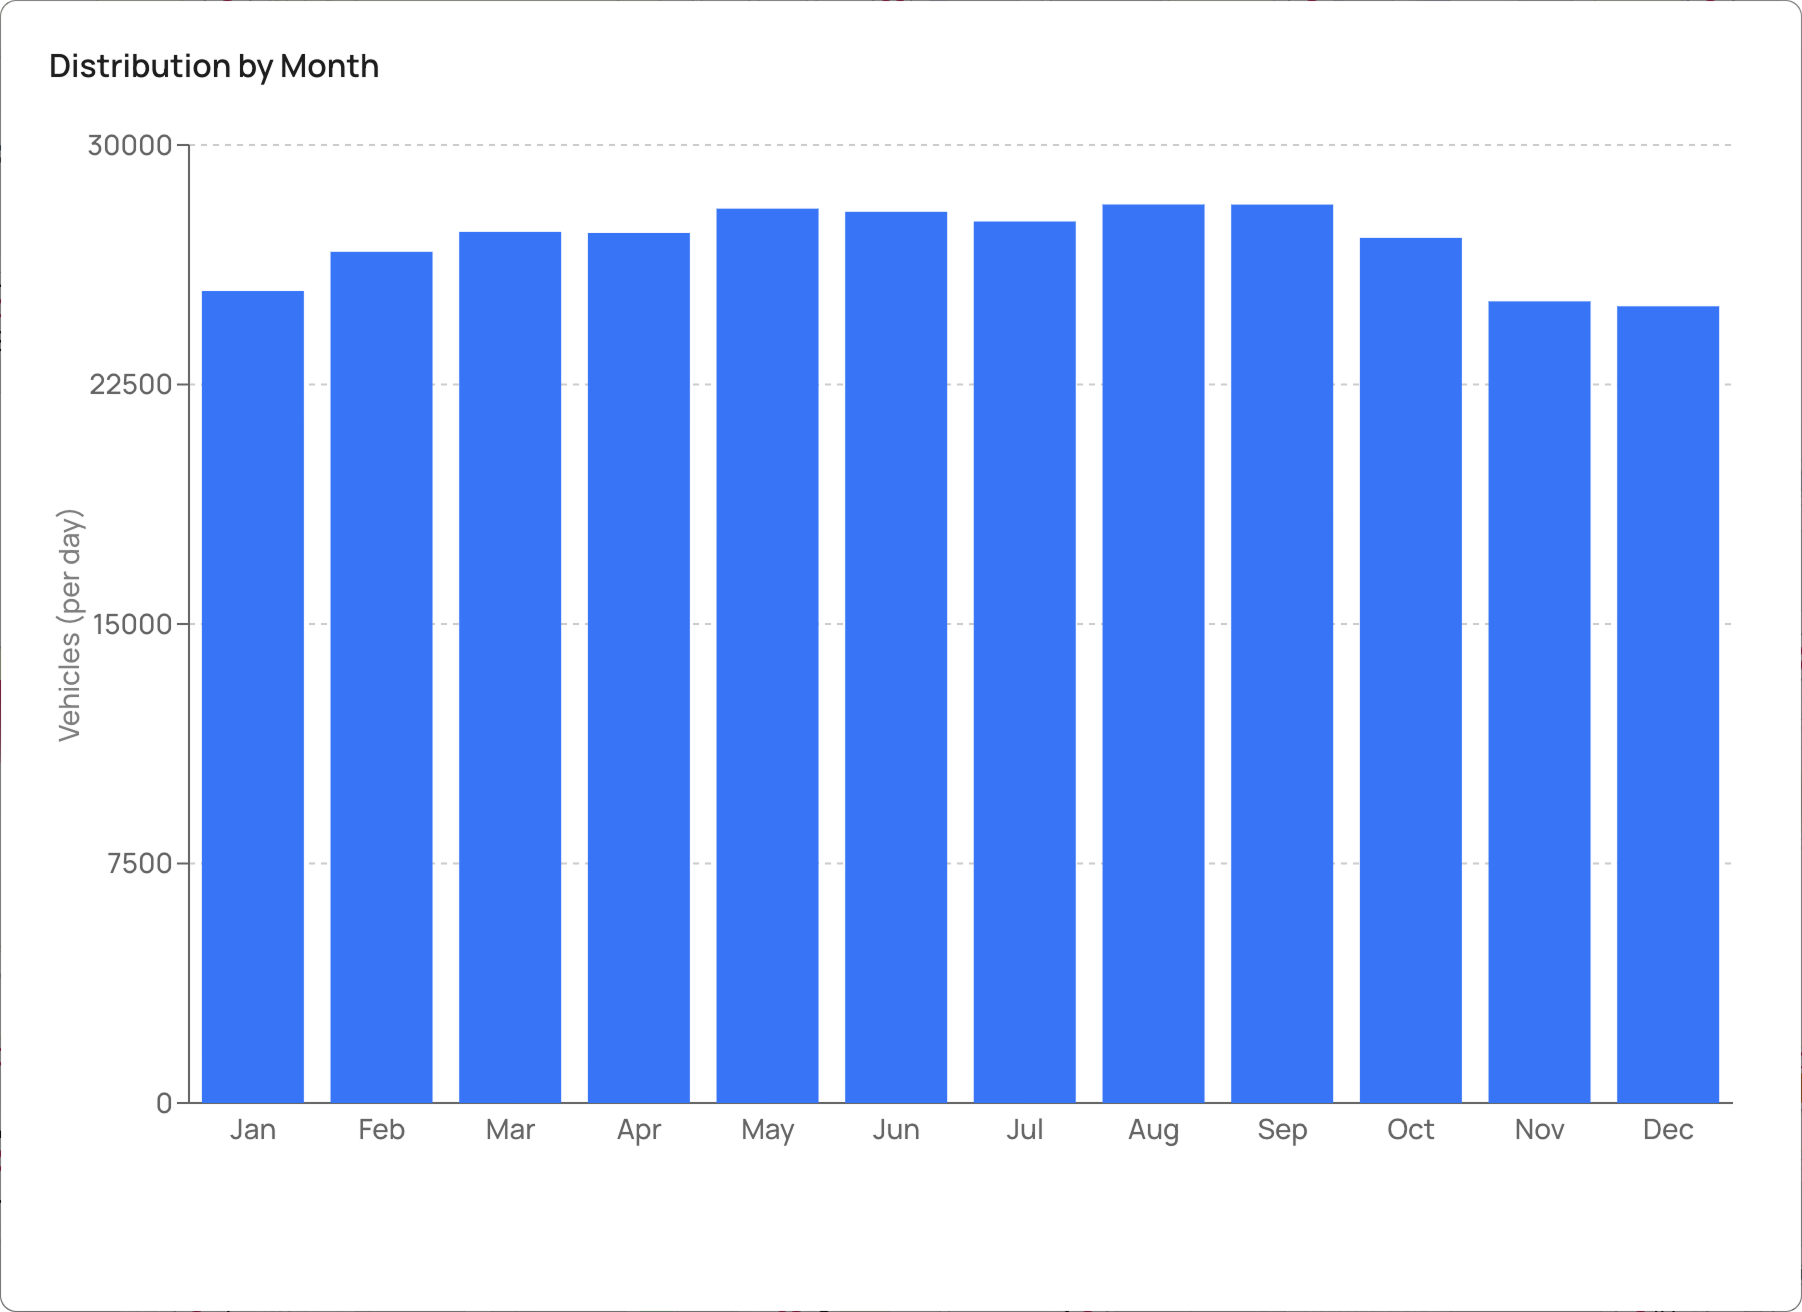
• True values of average daily traffic
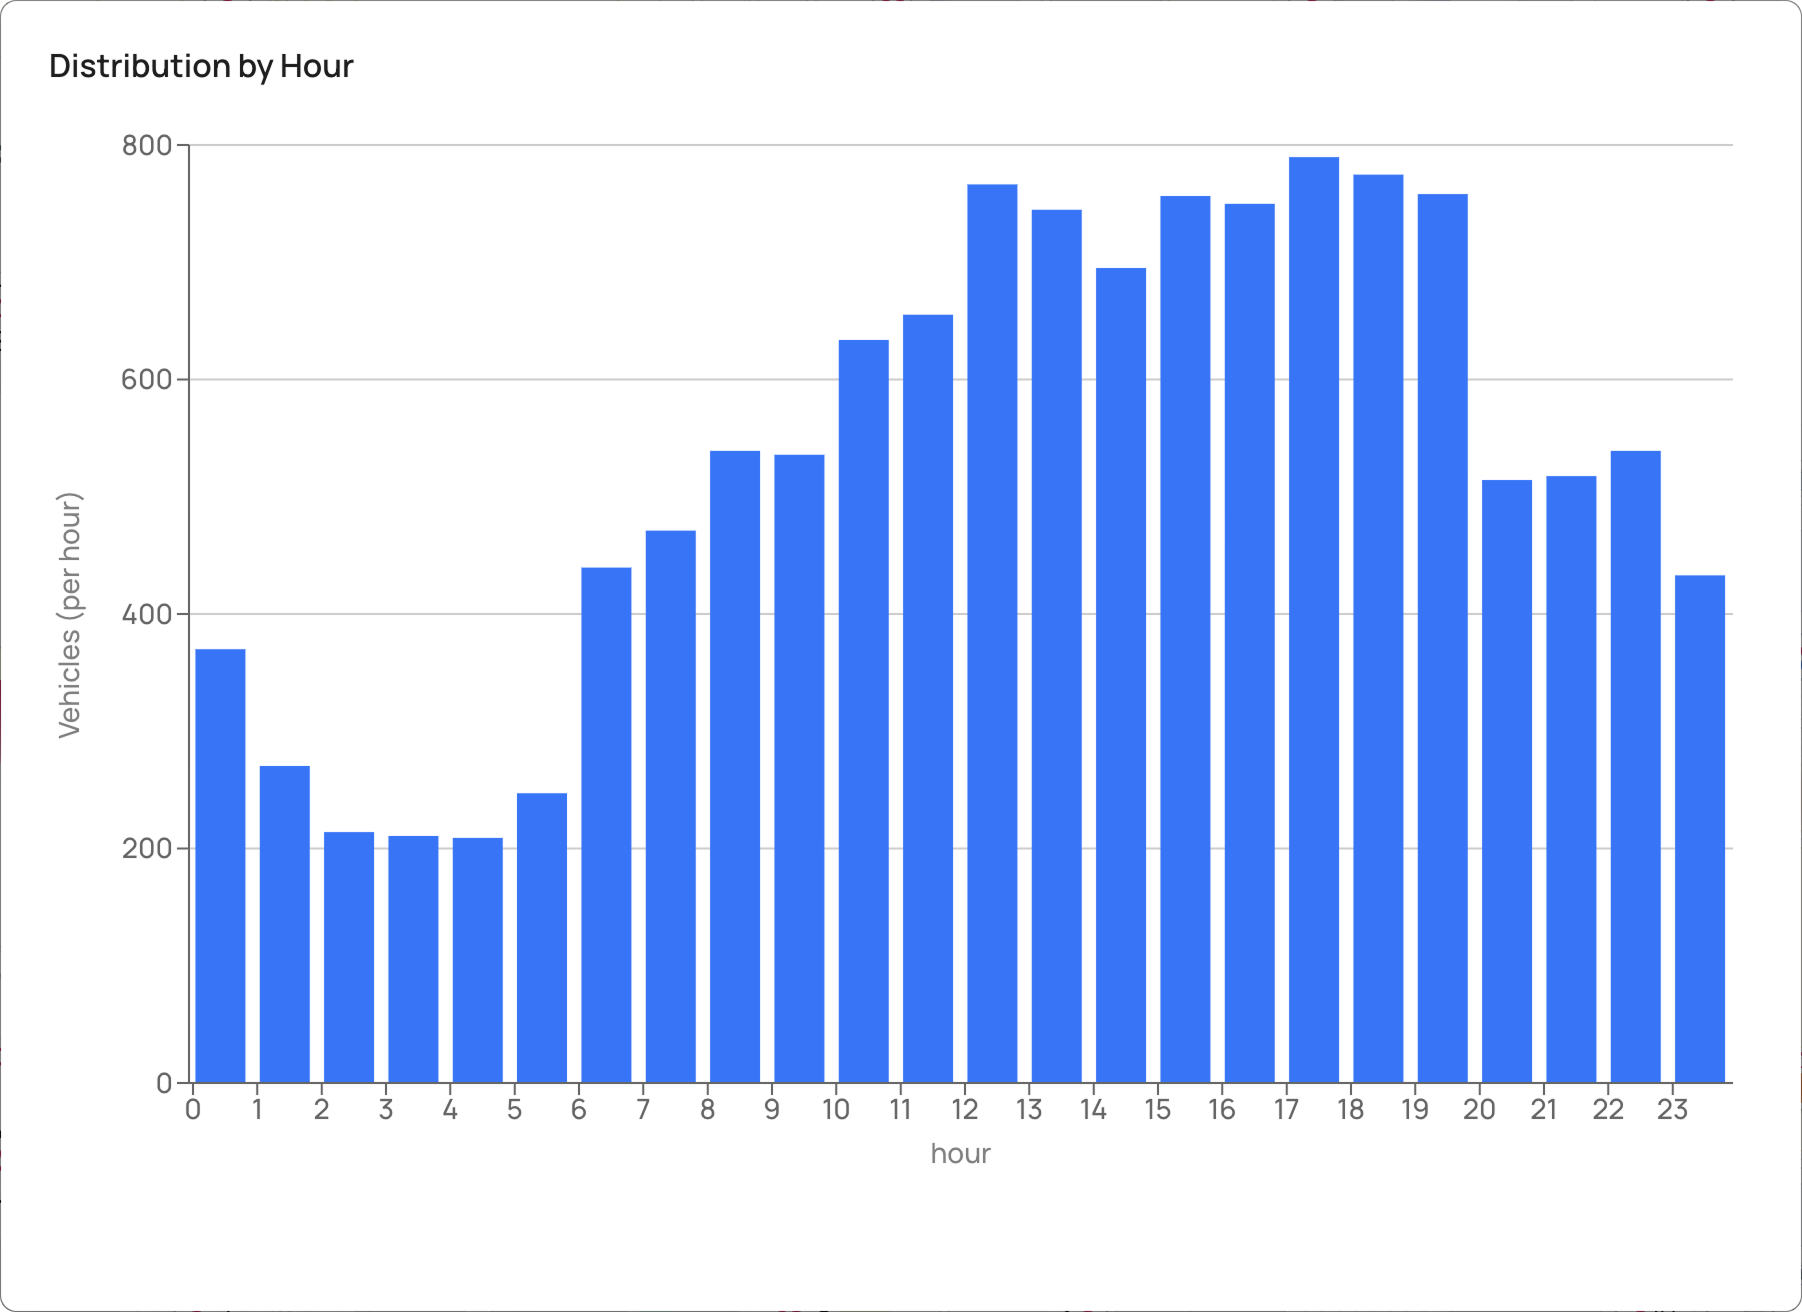
• Intra-day distribution of traffic flows
• Daily, monthly and yearly averages for traffic volumes
• Traffic flow speed and Drivers' behaviour data
• Featured Demographic information
• Congestion and Rush Hour analysis
All the above-mentioned information is available:
• For the exact street address, based on the observation of traffic at the location, not for a ZIP-code, polygon, miles-long TMC segment, or “nearby street"
• For the whole period of interest, based on continuous 24/7/365 observation, not for an “average week” or few days of tube-counter study
• Current and up-to-date (one week), rather than “last available” measurement, which may be years old.
Turns
Turns, a new Ticon analytic and reporting product, provides comprehensive support for signal timing optimization. Our product offers unique benefits to agencies responsible for arterial management and signal timing development, by providing:
• True values of average daily traffic
• Intraday distribution of traffic flows
• HCs compatible data format
• Turning movements with aggregation per your hardware needs
• Travel delays for right turns
• By-approach delay
• Comprehensive demand/delay metrics on intersectional level
All of the above is available:
• For the exact intersection, based on the observation of traffic at the location
• For the whole period of interest, based on continuous 24/7/365 observation, not for an “average week” or few days of tube-counter study
• Current and up-to-date (one week), rather than “last available” measurement, which may be years old.

Join the network to access Ticon case studies and to receive Ticon newsletters
@2023 Ticon